P-Curves
General Information
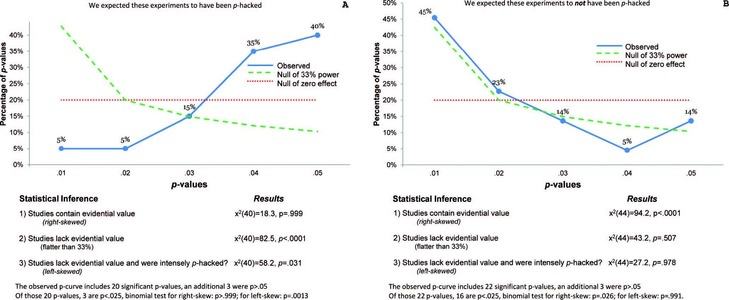
P-curves have been a popular way to test for publication bias in the field of academia because of the rise in p-hacking (click here to read about p-hacking). P-curve can be defined as “the distribution of statistically significant p values for a set of independent findings. Its shape is a diagnostic of the evidential value of that set of findings” (“P-Curve: A,” 2020). According to the workings of Simonsohn, Nelson, and Simmons who originally wrote about p-curves, in order for p-curves to work, the p-values must be associated with a hypothesis of interest, statistically independent from other selected p-values, and distributed uniformly under the null. One can analyze a p-curve by looking at which way the curve skews. For example, if the curve skewed to the right, there are more low (0.01s) than high (0.04s) significant p values, suggesting truly significant p-values. On the other hand, if a p-curve is skewed more to the left, this indicates more high p values than low ones; p-hacking has likely occurred. Please see charts below for examples.
To read more about using p-curves to detect p-hacking and publication bias, please check out the links below.
Here are some resources on the technique:
A Clarification of P-Curve Results: The Presence of Evidence Does Not Imply the Absence of Questionable Research Practices. (2018). Replicability-Index.
Bergmann, C. (2016). Metalab P-Curve. RPubs.
Bishop, D. V., & Thompson, P. A. (2016). Problems in using p-curve analysis and text-mining to detect rate of p-hacking and evidential value. PeerJ, 4(1715).
Bruns, S. B., & Ioannidis, J. P. (2016). P-curve and p-hacking in observational research. PloS oa>ne, 11(2), e0149144.
Enserink, M. (2012). Fraud detection method called credible but used like an ‘instrument of medieval torture’. Science Magazine.
Erdfelder, E., & Heck, D. W. (2019). Detecting Evidential Value and p-Hacking With the p-Curve Tool. Zeitschrift für Psychologie.
Gelman, A. (2018). The p-curve, p-uniform, and Hedges (1984) methods for meta-analysis under selection bias: An exchange with Blake McShane, Uri Simosohn, and Marcel van Assen. Statistical Modeling, Causal Inference, and Social Science
Gervais, W. (2015). Mission:p-curve. Will Gervais,
Hardcastle, M. J. (2015). The Effect of Selective Data Omission on Type I Error Rates: A Simulation Study (Doctoral dissertation, Texas A&M University).
Harrer, M., Cuijpers, P., Furukawa, T.A, & Ebert, D. D. (2019). Doing Meta-Analysis in R: A Hands-on Guide. Chapter 9.2.
Heino, M. The art of expecting p-values. Data Punk.
Lakens, D. (2017). Lakens, D. (2017). Professors are not elderly: Evaluating the evidential value of two social priming effects through p-curve analyses.
Leif, U. J. (2016). Ambitious P-Hacking and P-Curve 4.0. Data Colada.
McShane, B., Bockenholt, U., & Hansen, K. The p-curve is Not “Just Fine”. Blake McShane.
Nitschke, F. (2017, October). P-curve tutorial [Powerpoint Slides]. Open Science Meeting.
p-checker. ShinyApps: Experience Statistics.
P-Curve: A tool for detecting publication bias. (2020). FutureLearn.
Reisman, S., Balboul, M., & Jones, T. (2019). P-curve accurately rejects evidence for homeopathic ultramolecular dilutions. PeerJ, 7, e6318.
R/pcurve2.R. Perform a p-curve analysis. dmetar.
Schönbrodt, F. D. (2017). Assessing the evidential value of journals with p-curve, R-index, TIVA, etc: A comment on Motyl et al. (2017) with new data. Felix Schönbrodt’s blog.
Simmons, J.P. , Nelson, L.D., & Simonsohn, U. (2014). P-Curve: A Key to the File-Drawer. Journal of Experimental Psychology, 143(2), 534-537.
Simmons, J. P., & Simonsohn, U. (2017). Power posing: P-curving the evidence. Psychological Science.
Simonsohn, U., Nelson, L. D. & Simmons, J. P. (2018). P-Curve Won’t Do Your Laundry, But It Will Distinguish Replicable from Non-Replicable Findings in Observational Research: Comment on Bruns & Ioannidis (2016). Forthcoming, Plos ONE.
Simonsohn, U., Simmons, J. P., & Nelson, L. D. (2014) “P-Curve and Effect Size: Correcting for Publication Bias Using Only Significant Results” Perspectives on Psychological Science 9(6), 666-681.
Simonsohn, U., Simmons, J. P., & Nelson, L. D. (2015). Better P-curves: Making P-curve analysis more robust to errors, fraud, and ambitious P-hacking, a Reply to Ulrich and Miller (2015).
Tanner, S. (2015). Evidence of false positives in research clearinghouses and influential journals: An application of P-curve to policy research. Observational Studies, 1, 18-29.
Van Aert, R. C. M., Wicherts, J. M., & van Assen, M. A. L. M. (2016). Conducting Meta-Analyses Based on p Values: Reservations and Recommendations for Applying p-Uniform and p-Curve. Perspectives on Psychological Science, 11(5), 713–729.